As most traders know, markets doesn’t move in straight lines but in waves. For any timeframe you pick the moves of the market are based on this continuos rises and falls. Moves are quite random, but can be “structured” to see the trend (HH and HL for an uptrend for example and viceversa). So many retail traders are since a few weeks shorting this market because a fall “is overdue” trying to picks tops and miserably fail and shouting about conspiracies and market manipulations.
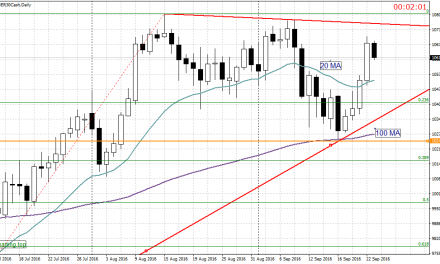
So let’s put things in perspective. Check the weekly Dax chart. The market has moved up and down according to the medium trend with usual pullbacks. Is all in the norm. No anomalies, just poor and unexperienced moaner traders shouting for no reason.
So what is next? Current weekly leg moved around 1400 pips. I checked the past and a 1400-1500 move without a pullback happened already. (there is a 2500 move as well…). So all is in the normality range. Chill out.
Ifyou get down to the daily (but is visible also in this weekly chart on your right) the inversed head and shoulder working as a charm from the 12600 neckline. If you check the latest candles you see also how long they are (Marabouzo the last one), meaning the buyers are in full control and with power.
What next? Is as always something that I try to interpret from the chart itself (markets act their own way as usual).
After the market has cleaned the 13180 fractal next is the all time high close to 13600.

Given that this move was around 1400 points and according to previous historical legs I do not think that the ATH can be reached without a pullback. Dax prices are over-extended and a pullback is necessary. What i think is that market from here (assuming next week will not push again hard on the upside) will possibly crawl down to the 12950 and then starting ranging between this level and 13300 before moving to the ATH.( a pullback to the 76.4 FIBO at 12600 and neckline of the inversed head and shoulder is possible too also if has a lower probability). This is of course one of the several possible scenarios.
Be aware that ther is a chance of the huge reverse head and shoulder (black curves lines on the chart) that at the cut of 13600 could send the index to the moon. Never discount a possibility with markets.