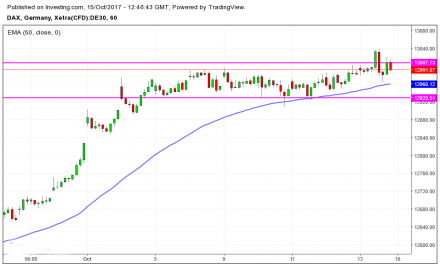

The index is still in a short term downtrend started since last month top and ranging in a quite wide channel. The 50 days Moving Average has been tested already three times, with lot of bearish action during last Friday where the dip buyers didn’t mange to pull up the prices above the 50DMA. Price resistance/support to watch for a break out are shown from the red trendline and the channel (yellow lines showing most likely a bearish flag pattern).Major resistance at 13200 and the important support at 12850.