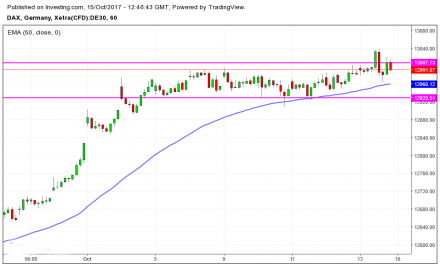
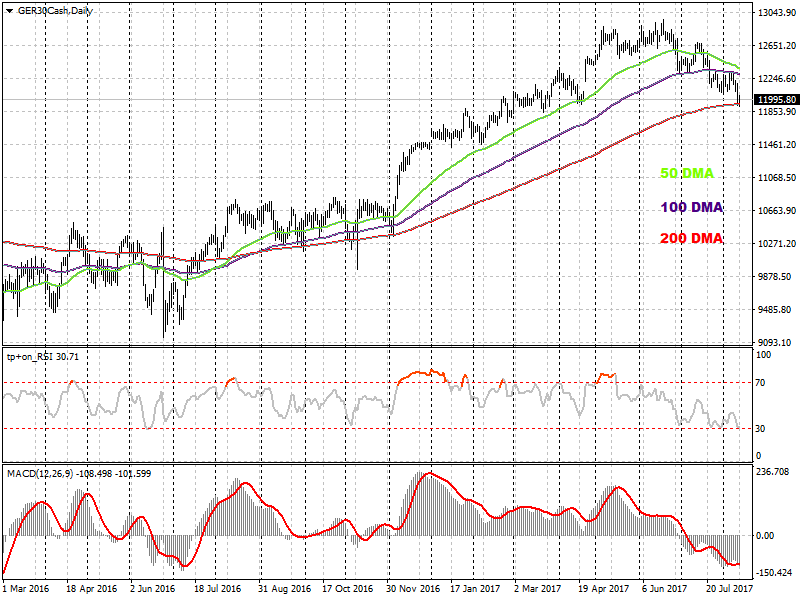
As I expected last week Dax continued its fall. I decided to have a look at the daily graph on a longer period of time.
We noticed how since November last year the index has been happily following its uptrend above the 50 DMA (green). In July however some cracks started to emerge as the 50 DMA was violated and the index began ranging supported by the 100 DMA (purple). We had , however a first signal in May when the RSI got out the overbought zone. Then the 100DMA support was finally broken and it started to act as resistance. Yesterday the price went right to the 200 DMA (red) that is an extremely strong support, where it rebounded to reach again the 12K mark. Is really evident that something big is probably going to happen: if you check the MACD you can easily discover how the signal line didn’t really cross the 0 since July 2016; now is well under and descending. On top of it the RSI is near to the 30 level that if crossed would expose the index to an oversold situation that hasn’t been in place since November 2015.
Other indicators are all pointing to the same direction. South. Something is cooking and DAX is just on the edge of the cliff. Crossing the 11930 level will possibly accelerate the selling pressure, with our first target set to 11500. Obviously it can well rebound from the 200 DMA trampoline.