One of the most important lines to keep well in mind when trading are undoubtebly historical levels of support and resistance that proved to be key signals for a long or short position. A broken resistance or support or a rejection would give a major hint on the direction of a trade. Trading the smaller timeframes having in mind a broader perspective doesn’t hurt at all.
I will take into analysis DAX the DOW 30 and Gold, highlighting the major closest levels to follow for a breakout or reversal (click on the chart for a larger image). Please note that levels shown (red lines), also if on the daily chart, take into consideration the higher timeframes (weekly and monthly).
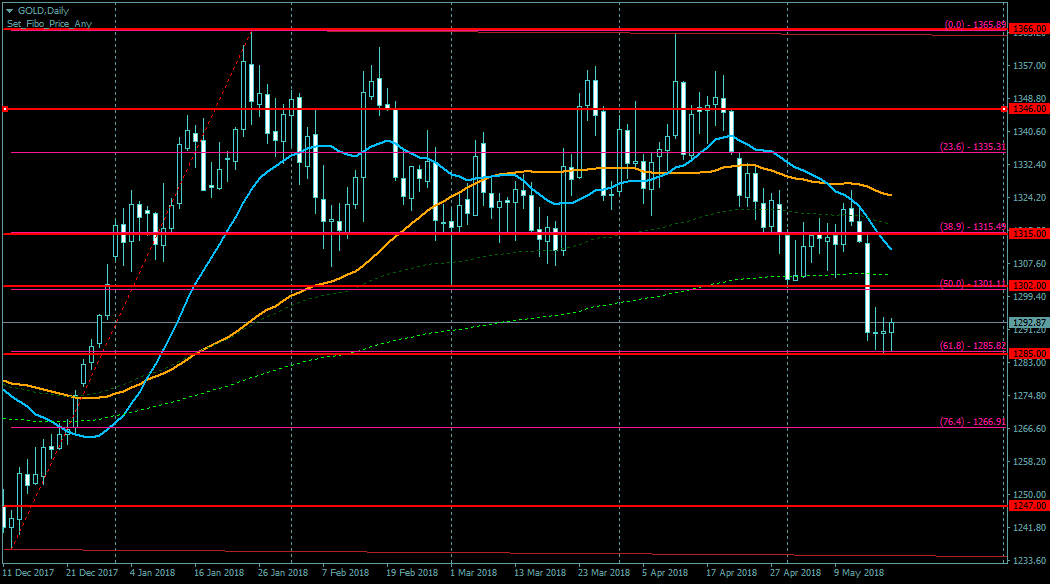
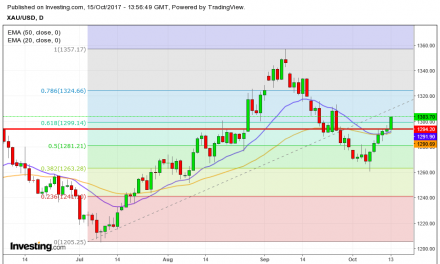
I have added also Fibonacci retracements (purple lines) on the daily that, in many cases are coincident with the key levels (see gold). The blue line is the 20 days EMA, while the yellow line is the 50 days EMA.

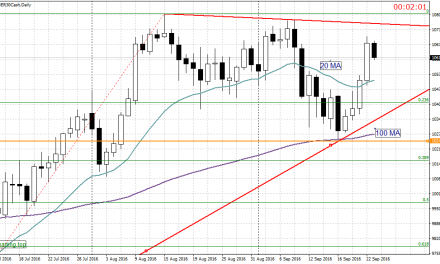
In the above chart DAX showed on all timeframes a considerable strenght after having broken the recent daily descending trendline. The 12650 level was a major hurdle. The breakout propelled the index up over the 13K mark. On friday the daily candle was stopped right at 13150 (or the 76.4 Fibonacci level). A break of the latter will drive the index toward 13500. A break of 12950 instead is needed for a decise downward movement.
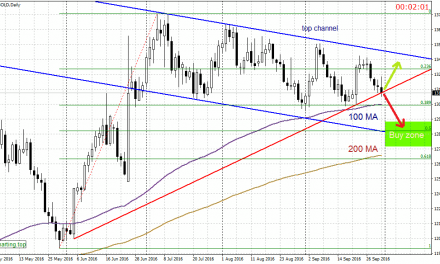
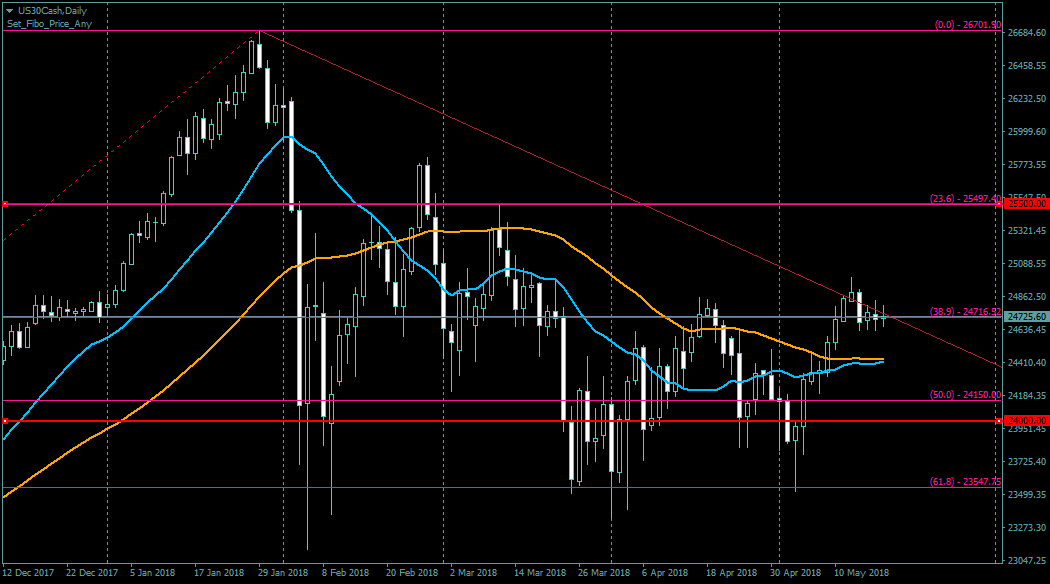
In the chart below the DOW 30 onthe other side, is still on a downward path. Interestingly, makor key levels are at the rounded numbers being the nearest 25500 and 24000. The index is showing a lot of indecision around the 24715 mark (38.9 Fibo retracement) and also the fact that both moving averages are basically horizontal. A decisive move up or down will show the way.
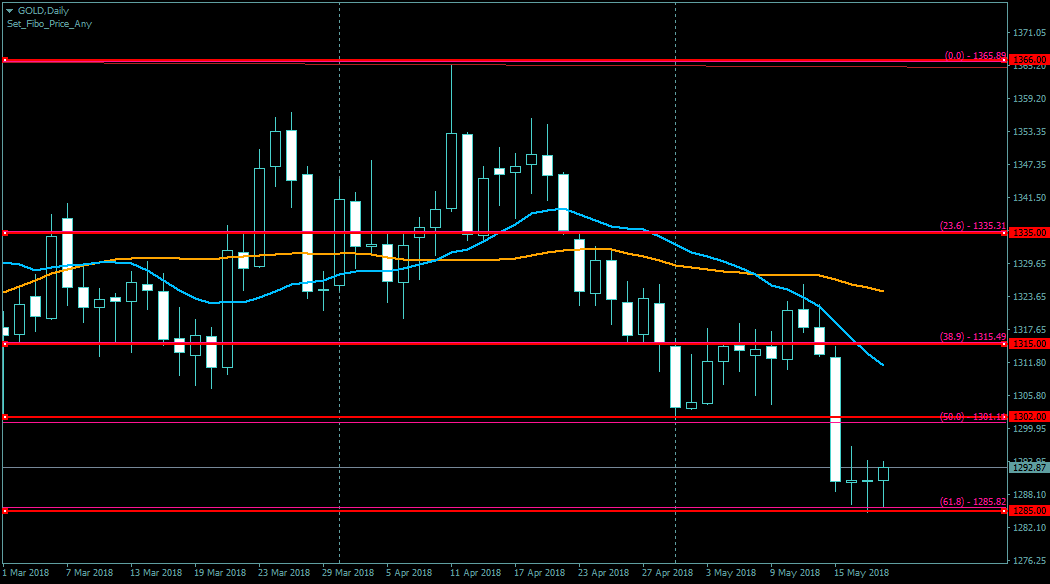
Now back to Gold where bulls have been completely slaughtered. I am showing on the next two images the same chart the second being a “zoomed” version of the first. Here levels are well defined and in many cases are the same of Fibo retracements. The 1300 mark has been tested several times since the beginning of the year. During last week the level finally capitulated. The important mark of 1285 since then showed resiliance (as it should do being a major one) and on Friday the yellow metal closed a bit over two undecisive doji giving some hope to the bulls. I would wait at least another daily candle before entering a long trade. The safest option would be waiting for price regaining the 200 days EMA (bright green dotted line) over the 1300 level. If the 1285 will be broken a further significant correction to 1250 dollars is likely.