
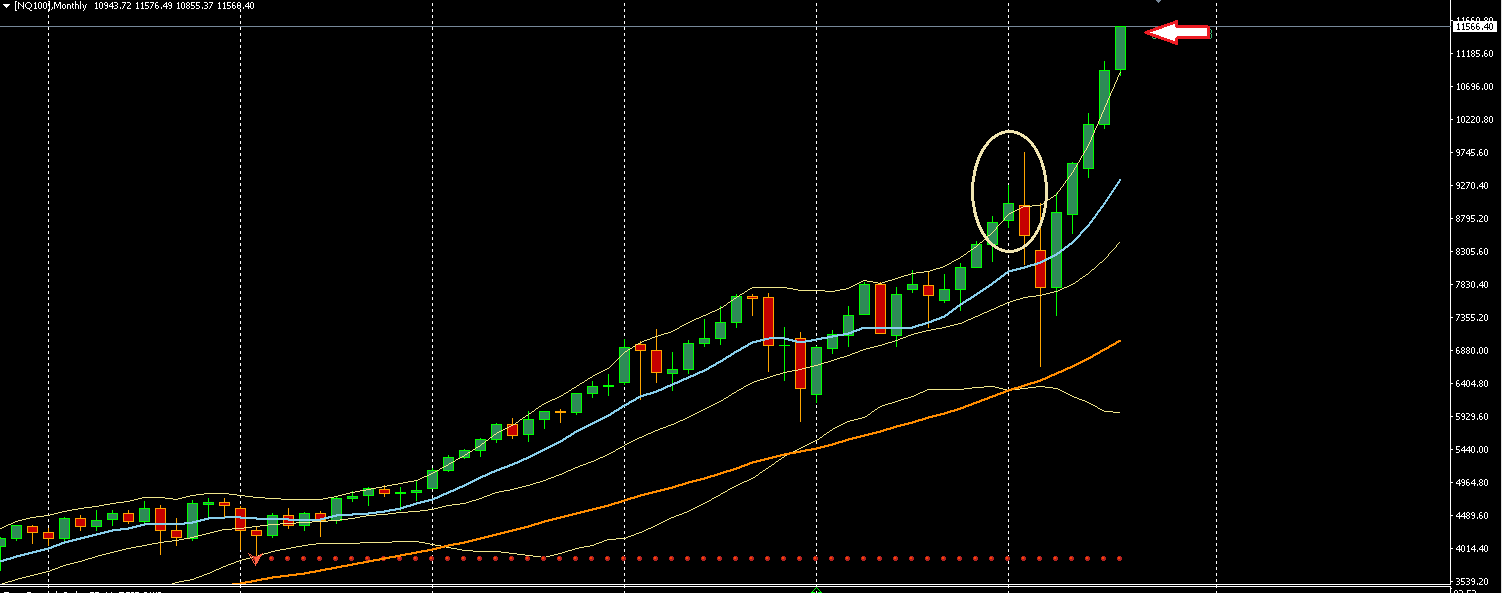
The chart above is one of the most amazing I ever witnessed. And we are not talking about an unknown penny stocks but is the Nasdaq 100. In this monthly chart is printed such an abnormality that surely is striking.
In this view you can’t check much of the past but I can reassure you that:
- the monthly candles rarely closed outside the Bolligender bands
- when it happened it never really overshoot them (apart during February 2020 that was however followed by a strong reverse in the following candle – check the candles in the circle)
We are now in a situation where the monthly candles have being closing outside the band for three months in a row and during current month (4th candle) of August the body is outside the BB in a exponential fashion.
This is something statistically extraordinary by history, experience and common sense.
Eventually it will reverse brutally.
I am not putting a timeframe on it.
Not trying to indicate a top.
I am just bragging.