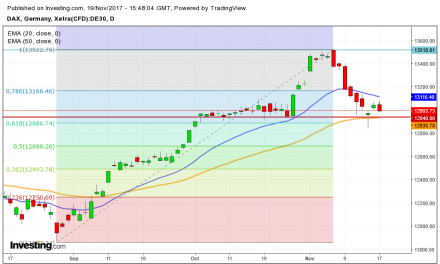
I think is just about time to explain why TA (technical analysis) works regardless of the naysayers and fundamental analyst that try to evaluate the “intrinsic” value of a security. Take as example my latest post on DAX analysis (14 October 2018) where succesfully have “predicted” the fall of the index having as target 10300 that will probably reached soon. Market movements can be forecasted thanks to patterns , price movements, indicators that can in a reliable manner study and sometimes anticipate supply and demand for any security. TA use a number of ways to estimate the likely possible outcome of chart patterns also thanks to candlesticks analysis, supports resistances, moving averages,channels and a number of indicators. Many fundamental analyst have been taken by surprise by the recent movements in the stock markets as ” fundamentals” in their view doesn’t reflect the ” effective value” of the underling companies. Me, as a technical analyst don’t bother with it. A TA follow the price trying to anticipate the likely outcome thanks to a statistical approach where market moves pattern repeat themself with time. In this way a TA has a statistical edge that includes market sentiment that will lead overall to more winning trades comparing to the losing ones.
I will not post any chart this time. Dax and DOW markets entered in a bear market. Statistically a bear market last 15 months (last bear market in the DOW lasted 17 months and deleted the 54% of nominal value). For how long this bear will stay in the market and how much will shave from companies valuation is impossible to tell. Just be prepared to a highest volatility and violent moves on each way. Selling the peak in this kind of environment can be highly rewarding. Just keep an eye as usal on monthly weekly and daily patterns for a reversal…