Another week is gone and price is now in a very interesting spot if we put it into perspective. Forget about macroeconomic, fundamentals , politics and the alike. Let’s have a look at the charts from a distance.
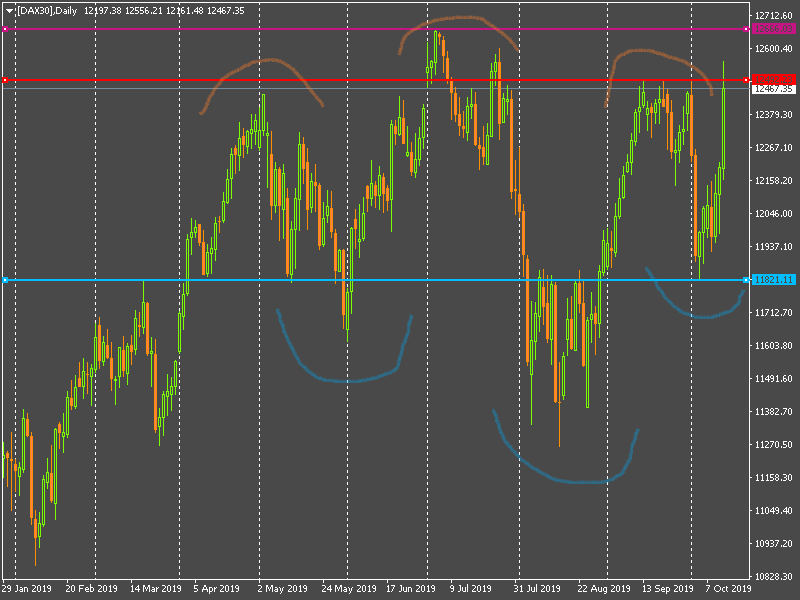
In the daily chart above we notice how we have a specular possibility of a H&S formation as well as an inversed H&S. The prices have been ranging into this (roughly) 11800 -12500 with a chance to break on the downside. Now the chances is reversed, momentum turned definetely bullish again with the latest strong daily candle pushing strongly for a breakout. Here it comes the different scenarios now in play.
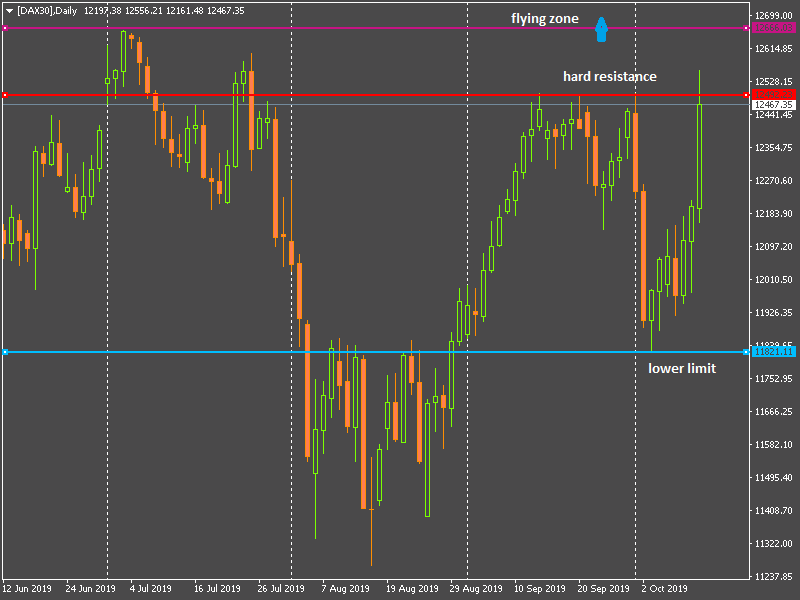
In the first scenario the Dax continues to range. Price has been stopped at the hard resistance and might crawl back down. After all breakout are not that common. Second scenario: the price breakouts and penetrates to what I called “the flying zone”. The inversed H&S would be validated and boost the price higher. This migh involved scenario 2a, with price starting accumulating in the range 12500-12660 for a while or 2b with price shooting directly over the flying zone. In both cases targets are set to reach well over the 13000 mark.
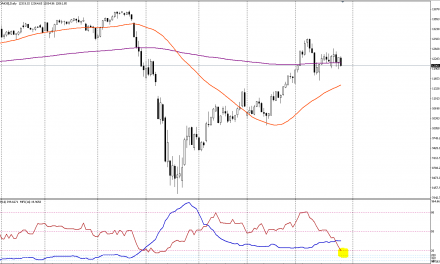
if we switch to the higher timeframe (weekly chart below), the reading is similar. However we can call a scenario three where the 12660 is the top of the weekly range. It would be a difficult task to give some probability to each scenarios. If we go back to fundamentals latest macros show a fast slowing economy but at the same more intervention (and liquidity) by the central bank.

Forecasting the next move? Just follow the price…